Irrational Exuberance: Why Your Retirement Savings May Be Half of What You Think
Sep 5, 2024 · from the Kaight v1 archive
The median Gen X retirement savings stand at around $250,000, and a striking 41% believe it would take a miracle for them to retire securely. Over the past decade, the market has indeed delivered what feels like that miracle, but a renown metric suggests a devastating crisis - even for millionaires.
Breaking It Down
The median Gen Xer is 52 years old, leaving about 13 years until the typical retirement age of 65. From 9/1/2011 to 9/1/2024, the S&P 500 delivered 14.6% nominal returns. Adjusted for 2.55% inflation, this equates to a real return of approximately 12% annually. If a Gen Xer had invested that $250,000 in a low-cost S&P 500 index fund like SPY during that period, it would have grown to a little over $1 million by retirement.
The median income for most Gen Xers is $101,500. If they contribute 15,000, roughly the recommended 15%, a year to their retirement fund, they will have an additional $386,000, bringing their total retirement savings to $1.44 million.
Data
| Age | Recent Returns |
|---|---|
| 52 | $250,000 |
| 53 | $289,119 |
| 54 | $338,662 |
| 55 | $416,610 |
| 56 | $418,519 |
| 57 | $463,446 |
| 58 | $526,605 |
| 59 | $615,258 |
| 60 | $621,418 |
| 61 | $746,814 |
| 62 | $929,687 |
| 63 | $762,629 |
| 64 | $851,777 |
| 65 | $1,056,593 |
Data
| Age | Recent Returns |
|---|---|
| 52 | $250,000 |
| 53 | $304,119 |
| 54 | $371,232 |
| 55 | $471,677 |
| 56 | $488,839 |
| 57 | $556,314 |
| 58 | $647,129 |
| 59 | $771,072 |
| 60 | $793,792 |
| 61 | $968,971 |
| 62 | $1,221,244 |
| 63 | $1,016,796 |
| 64 | $1,150,655 |
| 65 | $1,442,337 |
Combine that with the median Social Security benefit of $27,000, and you’re looking at a total retirement income of almost $85,000 per year. This amount falls within the commonly accepted rule that retirees need 80% of their pre-retirement income to maintain their lifestyle.
What About the Wealthy?
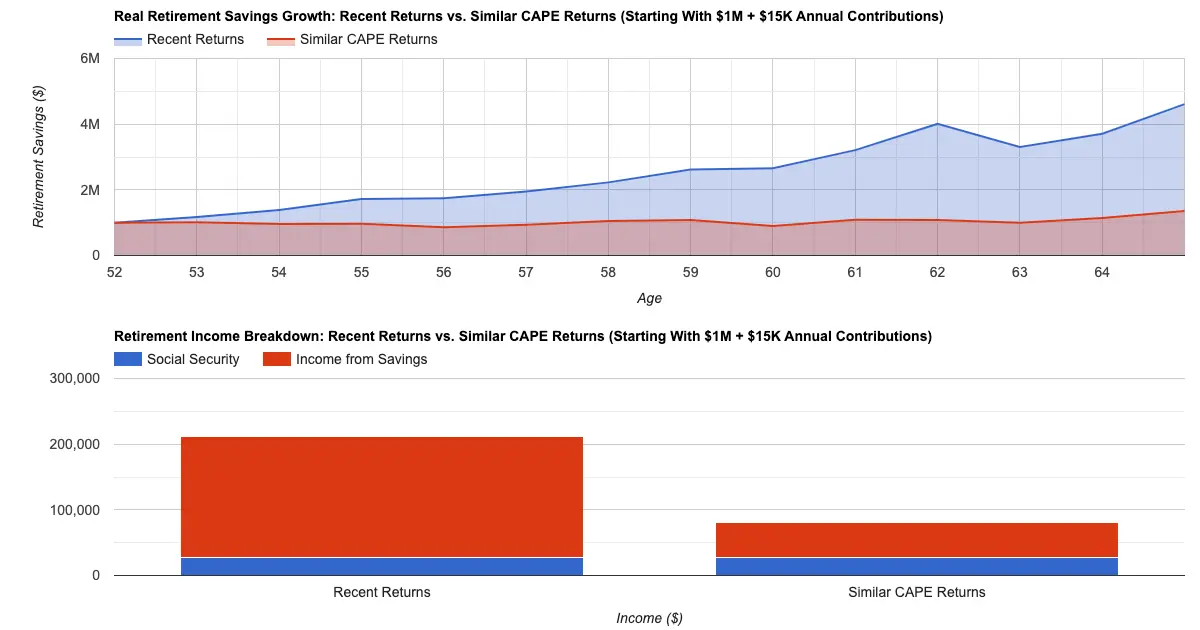
Even high net-worth individuals aren’t immune to market risk. Let’s consider the Gen Xer who has saved $1 million by age 52. If they contribute $15,000 annually, their savings will grow to $4.6 million by age 65. When combined with Social Security, this would generate a very comfortable $211,000/year in retirement income.
Miracle achieved? For now, yes—but this could just be recency bias bliss.
Irrational Exuberance?
Will the next decade look like the last? According to renowned economist Robert Shiller, the answer is likely no.
Shiller, famous for predicting both the dot-com crash and the housing market collapse, uses his Cyclically Adjusted Price-to-Earnings Ratio (CAPE) to assess long-term market valuations. The CAPE adjusts for inflation and smooths out earnings over a 10-year period, providing a more accurate picture of how expensive or cheap the market is relative to historical norms.
On 9/1/2024, the CAPE hit 35.55, one of the highest levels in history. By comparison, in 2011, the CAPE was just 19.70—a much more favorable environment for long-term investors. Historically, when the CAPE is this high, future returns are generally lower.
In fact, the only times the CAPE has been higher were during the dot-com bubble of the late 1990s and briefly following the post-COVID boom.
A Different Retirement Outlook
So, what happens when the market is this overvalued? If we look at the returns from the last time the CAPE ratio reached similar levels, the picture is starkly different. The CAPE hit 35.42 on 8/1/1998 as the dot-com bubble inflated, and it hovered around that level until it peaked at 44.19 in 1999 before crashing.
From 8/1/1998 to 8/1/2011, the S&P 500 returned a dismal 2.86% annually, barely keeping pace with inflation, which averaged 2.55%. This resulted in real returns of just 0.3% per year—a virtual lost decade for investors. Even for those who started after prices peaked on 2/1/2001, when the CAPE returned to 35.83, the following 13 years delivered only 1.7% real returns.
Average real returns: The average real return for a market with such a high CAPE ratio is around 1%.
A Devastatingly Different Retirement
If the next decade mirrors these past patterns, Gen Xers will face a harsh reality. The wealthy 52-year-old today with $1 million saved could see their nest egg grow to just $1.14 million by age 65, or $1.35 million with additional contributions. This is a stark contrast to the $4.6 million seen in the recent bull market. Their combined safe withdrawal and Social Security income would drop from nearly $212,000/year to just $81,100/year.
Data
| Age | Recent Returns | Similar CAPE Returns |
|---|---|---|
| 52 | $1,000,000 | $1,000,000 |
| 53 | $1,171,476 | $1,016,151 |
| 54 | $1,387,216 | $956,360 |
| 55 | $1,721,506 | $968,707 |
| 56 | $1,744,397 | $860,341 |
| 57 | $1,946,652 | $935,627 |
| 58 | $2,226,943 | $1,054,050 |
| 59 | $2,616,845 | $1,080,520 |
| 60 | $2,658,045 | $899,469 |
| 61 | $3,209,411 | $1,088,461 |
| 62 | $4,010,304 | $1,081,696 |
| 63 | $3,304,684 | $994,954 |
| 64 | $3,705,985 | $1,139,812 |
| 65 | $4,612,115 | $1,354,677 |
Data
| Income Source | Social Security | Income from Savings |
|---|---|---|
| Recent Returns | $27,000 | $184,485 |
| Similar CAPE Returns | $27,000 | $54,187 |
For the median Gen Xer with $250,000 saved, the future looks even more challenging. If their retirement savings grow at just 1%, even with $15,000/year in additional contributions, they’ll end up with less than $500,000 by retirement. That produces only $20,000 in annual income from savings, combined with Social Security for a total of $46,900/year. That’s far below the recommended 80% income replacement rule, and it may force many retirees to downsize or significantly cut back on their lifestyle.
Data
| Age | Recent Returns | Similar CAPE Returns |
|---|---|---|
| 52 | $250,000 | $250,000 |
| 53 | $304,119 | $265,100 |
| 54 | $371,232 | $259,770 |
| 55 | $471,677 | $274,559 |
| 56 | $488,839 | $254,607 |
| 57 | $556,314 | $286,161 |
| 58 | $647,129 | $331,417 |
| 59 | $771,072 | $347,805 |
| 60 | $793,792 | $296,569 |
| 61 | $968,971 | $367,485 |
| 62 | $1,221,244 | $374,732 |
| 63 | $1,016,796 | $353,320 |
| 64 | $1,150,655 | $412,133 |
| 65 | $1,442,337 | $497,114 |
Data
| Income Source | Social Security | Income from Savings |
|---|---|---|
| Recent Returns | $27,000 | $57,693 |
| Similar CAPE Returns | $27,000 | $19,885 |
What’s Next?
While the last decade’s market performance may feel like a miracle, future returns could be far less generous. Shiller’s CAPE warns us that the stock market is currently in a period of extreme overvaluation. Those planning for retirement should brace for the possibility that the next ten to fifteen years may not be as favorable as the last.
The lesson? It’s always a good idea to plan conservatively, diversify beyond just equities, and avoid relying on the stock market’s recent performance as a predictor of future success. Both the wealthy and the average saver should adjust their expectations and strategies accordingly to ensure a secure retirement, regardless of what the market brings.
Plan Your Retirement with Confidence
Don’t leave your financial future to chance. Get a personalized analysis and explore strategies to secure your retirement, even in uncertain market conditions.
Try Kaight, our AI financial planner, for free today and start planning for a retirement that can weather any market storm.